Dr. Colin Campbell, a senior research scientist at METER Group, as well as adjunct faculty at Washington State University teaches about relative humidity.
Comparing RH at different research sites can be a challenge
Watch the video to find out why we use the term relative humidity and why comparing RH at different research sites can be a challenge.
Video transcript
Why is humidity relative?
Hi, I’m Dr. Colin Campbell. I’m a senior research scientist here at METER Group, as well as adjunct faculty up at Washington State University. And I teach a class in environmental biophysics. And today, we’re going to be talking about relative humidity. Have you ever looked at a weather report and wondered, what do they mean by the term relative? Why aren’t we talking about absolute things? And so today I’m going to talk about what is relative humidity? Well, relative humidity we’re going to define here as just hr. And hr is equal to the partial pressure of water vapor in air divided by the saturation vapor pressure or the maximum possible partial pressure of water in air as a function of temperature. So this is relative because anytime we have a partial pressure of water vapor, we’re always dividing it by the maximum possible water vapor that could be in the air at any point.
Comparing RH at different sites is a challenge
So, why would relative humidity be such a challenge for us as scientists to use in comparing different sites? I wanted to talk about that so we can focus in here on this saturation vapor pressure. Over here we have Tetens equation. This says that the saturation vapor pressure, which is a function of air temperature is equal to 0.611 kPa times the exponential of a constant “b” times the air temperature divided by another constant “c” plus the air temperature. So at any point, depending on the air temperature, we can calculate the saturation vapor pressure, and then we can put it back into this equation and get our relative humidity. There are two situations we might think about for calculating our saturation vapor pressure. The most typical is this one: where that constant “b” is 17.502 degrees C. And the constant “c” is 240.97 degrees C (the units on this are degrees C, so these will cancel). If we’re over ice, those constants will be different: “b” would be 21.87 degrees C and “c” would be 265.5 degrees C.
So as I mentioned, relative humidity is a challenging variable to use in research because while vapor pressure (ea) (the vapor pressure of the air) is somewhat conservative across a day, the saturation vapor pressure (with respect to air temperature), this changes slowly with temperature across the day. So if we graphed temperature on one axis and the relative humidity on the other axis, we might during a typical day have a temperature range that looks somewhat like this. And even if the actual vapor pressure “ea” wasn’t changing, we’d see a relative humidity trend that looked like this: only changing because of air temperature. And because of that, if we wondered how do I compare the water in the air at one research site, for example, with the water in the air at another research site? We might be inclined to average them. But because of this trend, the average of the relative humidity at any site tends to be around 0.60 to 0.65 and therefore will be totally irrelevant in the literature.
So we need to speak in absolutes, and in my next lecture, I’m going to go into what we can do to calculate that absolute relative humidity. If you want to know more about making measurements in the atmosphere, go to metergroup.com, look at our atmospheric instrumentation, and you can learn more from there.
Meet Christopher Beltz: G.A. Harris Fellowship winner
Increased nitrogen availability has the potential to alter many ecosystem functions—and is doing so already. This is due to the widespread response of net primary productivity (biomass) and soil respiration to increased nitrogen inputs into the biosphere.
Grass Lands
Increases in nitrogen inputs are responsible for the acidification of soils, streams, and lakes and can affect forest and grassland productivity. Former G.A. Harris Fellowship winner, Christopher Beltz, a PhD student at Yale University, and his research team are examining two major drivers of carbon cycling: water and nitrogen. They want to understand the degree of limitation by both of these factors in the semi-arid ecosystems of the western United States and if that limitation changes by specific function.
Inspired by a mitigation pilot project
Beltz decided to study the effects of increased nitrogen on biomass after learning about the initiation of a major energy development in a sagebrush steppe system which caused declines in a local mule deer herd. He says, “One hypothesis was that the development significantly reduced available winter range forage and also impacted the use of it as the animals moved more quickly through the noisy environment. They wanted to see if the widespread application of fertilizers would potentially offset the loss of biomass and increase the forage quality. In the end, it was clear that the effect of nitrogen fertilization alone would have minimal to no effect. However we also noticed some variability in the results and that this variability seemed to be related to precipitation.”
Scientist Watering Field Plot
Beltz thought that if he could control the water in a system in addition to nitrogen, the results might be more consistent. Thus, Beltz and his research team broadcast nitrogen over the soil at three semi-arid grassland and shrubland/sagebrush sites in Colorado and Wyoming. He says, “The three sites essentially have a similar species list, annual precipitation, and annual temperature. However, temperature increases as you go south, and there are some differences in seasonality. The shrublands in the far north are the driest in the late summer which is typical of shrublands, where you see a large amount of precipitation occurring in the spring with a deficit in the summer. Larger taproots are beneficial in this system because they can access deeper water reservoirs.”
Measuring soil moisture improves understanding
The team used METER all-in-one weather stations, soil moisture sensors, and data loggers to monitor site conditions (i.e., precipitation, air temperature, soil moisture, and soil temperature) with high temporal resolution. Beltz explains, “We monitored soil moisture to understand whether our treatments were having any effect. We needed to know if the treatments actually altered the soil water conditions. With soil sensors in the ground, we could monitor that. We also monitored precipitation at the site level because of the fine scale spatial heterogeneity of precipitation in these systems. We weren’t confident we could obtain this with interpolation or modeling; we wanted site-specific values.”
Beltz uses this and other data to understand the interactive effects of nitrogen and water and also changes in water and nitrogen concentrations. He says, “We do a classic full-factorial manipulation outdoors. We perform the exact same manipulations with the same timing at each site. We measure a whole suite of variables that range from ecosystem structure to ecosystem function. This includes soil respiration, plant community, soil microbial communities (fungal and bacterial) using next-generation sequencing. We look at pools of soil carbon, and we do some fractionation so we can get at more labile and recalcitrant carbon compounds.”
METER Weather Station, ZL6 Data Logger, and Soil Moisture Sensors to Receive and Process Data
Beltz says that monitoring soil moisture at multiple depths is important. “Our soil samples come from the same depths as the sensors so we can differentiate depth when we look at changes in bacterial or fungal composition. We then try to tie that to temperature and moisture. In 2018, we added an additional set of soil moisture sensors in our water treatment so we could start to quantify the effect in the soil depth that those water treatments were having. This helped explain a lot of what we were seeing.”
Nitrogen or water: which is the driver?
Beltz says the analyses are ongoing, but what they’ve learned so far is that an application of water equivalent to 12 millimeters precipitation penetrates to 10 centimeters of depth, and the effect of that application lasts three to seven days at all of their sites. He says, “Last year, we had an unseasonably large amount of precipitation at our northerly site. So for most of the season, the water treatments and the controls were identical in terms of water availability. That was a very helpful context for us because we started to see things that did not match the expected patterns.”
Looking at the big picture, he adds, “What’s come out of this is not what anybody expected. One major finding, at least in the initial analyses at two of our sites, is that it’s really the combined treatment of increased nitrogen and water that has the effect. This is not necessarily surprising in some ways, however it is the widespread lack of response of any other treatment combination that is extremely interesting.”
What it all means
Beltz sums up the implications of his research like this: “We know water availability and precipitation will shift globally due to climate change, as well as nitrogen deposition and availability. Our research is trying to tease apart the effects of two factors, at least within the western United States, that we know are likely to cause changes to the structure and function of dryland ecosystems. As we start to look at carbon balance or shifts in function or species competition of plant communities, we are finding out that it’s the combined effect of increased nitrogen and water that will cause a more major change as opposed to just one or the other. It’s important that we integrate that combination into models that often do not account for both of these factors.”
Beltz says in the future he’s interested in continuing his work in the carbon/nitrogen cycle world, and he wants to look at integrating nitrogen and water into carbon balance modeling efforts.
You can read more about the first study mentioned, regarding nitrogen fertilization in the sagebrush steppe, which was published in PloS ONE: https://doi.org/10.1371/journal.pone.0206563
Find out about his research here: christopherbeltz.com or via Twitter @BeltzEcology
Now accepting applications: 2019 G. A. Harris Fellowship
The Grant A. Harris Fellowship provides $60,000 worth of METER research instrumentation (six $10,000 awards) to graduate students studying any aspect of agricultural, environmental, or geotechnical science.
Engineers Without Borders (EWB) at Washington State University in Pullman, WA has partnered with a small indigenous village located in the Comarca Ngäbe-Buglé region of Panama. The relationship between this village and EWB at WSU began in 2016 when WSU alumna Destry Seiler began living in the village as a Peace Corps volunteer hoping to help solve the community’s water security needs.
A view of the Comarca Ngäbe-Buglé taken from the village in Panama.
During the rainy season in this village, approximately 20 households have access to water through a two-inch PVC pipe that operates by gravity. It runs approximately 1.5 kilometers through the jungle from a spring source higher in the mountain to small hose spickets located close to the homes on the distribution line. The other ~80 households do not have access to the distribution line and walk to the closest river or creek up to five times a day to find water. However, during the dry season, most spring sources dry up, leaving all households in the community to walk to the diminished supply of rivers to find their water.
A view of the water line currently serving ~20 homes in the village during the rainy season.
The village initially requested assistance from the Peace Corps in order to find a year-round source of clean water. But, after living in the village for 1.5 years, Ms. Seiler could not locate spring sources that both survived through the dry season and could also reach the homes in need through a gravity fed system.
Then Ms. Seiler began thinking of groundwater as a possible new water source for the community. Unfortunately, groundwater data for the Comarca Ngäbe-Buglé was not available from the local government agency. So she decided to reach out to WSU professor, Dr. Karl Olsen, to ask for assistance with a groundwater research project, and the EWB club was formed.
The club visited the village for the first time along with Ms. Seiler and faculty mentor Dr. Karl Olsen in August 2018 to do an initial survey of water use and needs, as well as to create a first-ever map of the area. EWB will return to Panama this June 2019 to implement a solar-powered water pump requested by a section of the community to deliver water from a spring source to approximately 20 homes on the nearest ridgeline. The club will also install latrines in a nearby community. They will continue the groundwater survey of the area through more extensive mapping and perform a more advanced analysis with the support of a local hydrologic company.
EWB members and WSU students Patrick Roubicaud, Kristy Watson, Destry Seiler, Perri Piller, Rene McMinn, and Kevin Allen during their visit to Panama, August 2018.
The team will use a METER-donated ATMOS 41 weather station along with a ZL6 data logger and ZENTRA Cloud software to assist in the data collection necessary to begin mapping groundwater in the area. The weather station will record precipitation, solar radiation, vapor pressure, temperature, wind, and relative humidity data that will enable EWB to begin to quantify environmental conditions and available water supply. When combined with streamflow data from rivers in the area, groundwater availability can also begin to be estimated. Because of ZENTRA Cloud, EWB will be able to view this information near-real time as well as share it with the village to help guide their design decisions. EWB plans to install the ATMOS 41 at a nearby village school to ensure weather station security and to provide an opportunity for local students to learn about their surrounding environment in a way they have not been able to do before.
To learn more about the Panamanian village or the work EWB from WSU is doing, visit ewb.wsu.edu.
See weather sensor performance data for the ATMOS 41 weather station.
Some people figured it was climate change. One statistician said it was a part of a cyclical trend for poor crop years. Whatever the cause, the 2017 flash drought that parched the entire state of Montana and most of South Dakota, severely impacted the profitability of ranchers and farmers. In western Montana, fires burned some of the largest acreages in recent history. It resulted in one of the biggest wildfire incident reports (over one-million acres) and caused virtually 100% crop loss in northeastern Montana. The U.S. Dept. of Agriculture estimated the crop loss to be in the hundreds of millions of dollars, and one question was on everybody’s mind—why did no one see it coming?
Figure 1. Montana drought conditions August 2017 (Source: Montana State Library website: https://mslservices.mt.gov/Geographic_Information/Maps/drought/)
Getting the right weather data
The 2017 Montana Dept. of Natural Resources and Conservation spring drought report indicated plenty of water: “By the end of the month, almost all drought concern was removed from the state, with the exception of Wibaux and Fallon Counties….As of May 9, 2017, Montana was 98.45% drought free.” But in late May, an abrupt shift in weather conditions led to one of the hottest, driest summers on record.
The problem, says Kevin Hyde, Montana State Mesonet Coordinator, lies not only in the need for more weather data but in obtaining the right kind of data. He says, “One of the reasons drought was missed was because we’re still thinking you measure drought by snowpack and how much water is in the river, which is really great if you’ve got water rights. But we’ve got a lot of dryland out there.”
In addition to weather monitoring, Hyde is a big proponent of adding soil moisture and NDVI measurements to each of the Montana Mesonet stations he oversees. He says, “The conventional weather station only measures atmospheric conditions. But ultimately, to make any decisions, we’ve got to know not just how much water comes into the system, but how much goes into the soil. And even that’s not enough…because what we really need to know is how the water situation is going to affect plants.”
Hyde says more data are needed to warn growers and ranchers about upcoming weather risks. He points to the fact that increasing evapotranspiration got missed leading up to the summer of 2017. “We realized that if we were looking carefully at reference ET, we might have seen it about a month earlier. What would people have done? They would have changed their calf purchases. They would have figured out what kind of forage they needed to buy. These are the types of decisions people can make if they know the information sooner.”
Was the drought over? Soil moisture illuminates the bigger picture
Heavy rains came mid-September of 2017, which led some people to believe the drought was over. However, changes in soil moisture told a different story. Very little of the rain made it into the soil. “At the Havre, MT station you can see we had some heavy precipitation events. Then we had early October snows. So people expected good soil water recharge. But at the end of the day, we didn’t get it. On Sept.15th, soil moisture sensors showed a big soil moisture response at the surface but only a marginal response at 8 inches.” The melt of early October snows onto the soil, still damp from the September rain, drained to 20 inches or more. But as the snowmelt dissipated, there was minimal net gain going into the winter.
Figure 2. Soil moisture traces at the Havre, MT weather station
Predictive models need more coverage to be effective
Typically in the U.S., the National Weather Service (a division of NOAA) puts out a network of weather monitoring stations spaced out across the country, and that data gets fed into forward-looking models that help predict the weather. Dr. Doug Cobos, research scientist at METER says, “What people are finding out is that putting in a sparse network of very expensive systems has done really well. It’s been a good thing. But the spatial gaps in those networks are a problem, especially for agriculture producers and ranchers. They need to know what’s happening where they are.”
Hyde agrees, adding that we need better predictive tools that help growers and ranchers make practical decisions based on data rather than guessing. “January 1st is when the decision has to be made—do I buy cows? Do I sell cows? Do I need more pasture? But many predictions start on April 1st. As one rancher puts it, ‘We don’t bother with Las Vegas. We sit around the dining room table at the beginning of the year and put a million dollars on one shot.’”
Mesonets improve spatial distribution
Mesonets present a practical solution for the need to fill in data gaps between large, complex weather stations. The Montana Mesonet currently has 57 stations interspersed throughout the state, and through partnerships with both the public and private sector, they’re adding more stations every year.
Figure 3. Map of MT Mesonet weather stations (source: http://climate.umt.edu/mesonet/)
At each location, the Montana Mesonet team installs METER all-in-one weather stations, soil moisture sensors, NDVI sensors and data loggers that integrate with ZENTRA Cloud: an easy-to-use web software that seamlessly integrates into third-party applications through an API. He says the system enables better spatial distribution and reliability. “When we were deciding on equipment we asked ourselves: What kind of technology should we use? It had to provide high data integrity. It had to be easy to deploy and maintain. And it had to be cost effective. There’s not a lot of people in that sector. METER systems are low profile, they’re affordable, and the reliability is there. I look at some other mesonets, and they cannot afford to build out further because they are relying on large, complex, expensive systems. That’s where the METER system comes into play.”
Figure 4. Montana Mesonet station setup (Photo credit: Kevin Hyde)
Betting on the future
The Mesonet team and its partners are excited to see how their data will mesh with the available predictive tools to be the most useful and practical for growers and ranchers throughout the state, and they realize that there is still much work to do. “It’s not enough just to get the instrumentation out there. The overall crux is: how do we build the information network, and how do we build a relationship with the producers so that we can have an iterative and interactive conversation?” says Hyde. “We know there needs to be an education in how to use and interpret the data. For example: what is NDVI, and what can we learn from it? A lot of what we need to do is translate science into practical terms.” But he adds that it doesn’t need to be perfect. “What the farmers have said to us is, ‘We don’t need exact numbers. We’re gamblers. Give us probability. Teach us what it means, and we’ll make the decision.’”
Find more information on the Montana Mesonet here and in their newsletter.
Climate parameters such as precipitation, air temperature, and wind speed can change considerably across short distances in the natural environment. However, most weather observations either sacrifice spatial resolution for scientific accuracy or research-grade accuracy for spatial resolution.
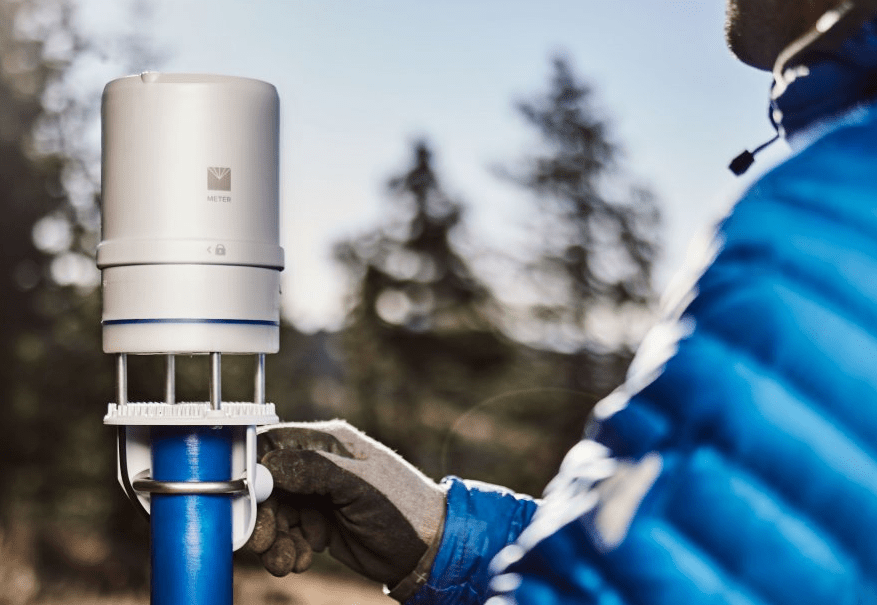
ATMOS 41 all-in-one weather station
The ATMOS 41 represents an optimization of both. It was carefully engineered to maximize accuracy at a price point that allows for spatially distributed observations. Additionally, because many researchers need to avoid frequent maintenance and long setup times, the ATMOS 41 weather station was designed to reduce complexity and withstand long-term deployment in harsh environments. To eliminate breakage, it contains no moving parts, and it only requires recalibration every two years. Since all 14 measurements are combined in a single unit, it can be deployed quickly and with almost no effort. Its only requirement is to be mounted and leveled on top of a pole with an unobstructed view of the sky.
Comparison testing and sensor-to-sensor variability data
METER released the ATMOS 41 in January 2017 after extensive development and testing with partnerships across the world, in Africa, Europe, and the US. We performed comparison testing with high-quality, research-grade non-METER sensors and conducted time-series testing for sensor-to-sensor variability.
See weather sensor performance data for the ATMOS 41 weather station.
Every researcher’s goal is to obtain usable field data for the entire duration of a study. A good data set is one a scientist can use to draw conclusions or learn something about the behavior of environmental factors in a particular application. However, as many researchers have painfully discovered, getting good data is not as simple as installing sensors, leaving them in the field, and returning to find an accurate record. Those who don’t plan ahead, check the data often, and troubleshoot regularly often come back to find unpleasant surprises such as unplugged data logger cables, soil moisture sensor cables damaged by rodents, or worse: that they don’t have enough data to interpret their results. Fortunately, most data collection mishaps are avoidable with quality equipment, some careful forethought, and a small amount of preparation.
Before selecting a site, scientists should clearly define their goals for gathering data.
Make no mistake, it will cost you
Below are some common mistakes people make when designing a study that cost them time and money and may prevent their data from being usable.
Site characterization: Not enough is known about the site, its variability, or other influential environmental factors that guide data interpretation
Sensor location: Sensors are installed in a location that doesn’t address the goals of the study (i.e., in soils, both the geographic location of the sensors and the location in the soil profile must be applicable to the research question)
Sensor installation: Sensors are not installed correctly, causing inaccurate readings
Data collection: Sensors and logger are not protected, and data are not checked regularly to maintain a continuous and accurate data record
Data dissemination: Data cannot be understood or replicated by other scientists
When designing a study, use the following best practices to simplify data collection and avoid oversights that keep data from being usable and ultimately, publishable.
Dr. Yossi Osroosh, Precision Ag Engineer in the Department of Biological Systems Engineering at Washington State University, continues (see part 1) to discuss the strengths and limitations of IoT technologies for irrigation water management.
Informed irrigation decisions require real-time data from networks of soil and weather sensors at desired resolution and at a reasonable cost.
LoRaWAN (a vendor-managed solution see part 1) is ideal for monitoring applications where sensors need to send data only a couple of times per day with very high battery life at a very low cost. Cellular IoT, on the other hand, works best for agricultural applications where sensors are required to send data more frequently and irrigation valves need to be turned on/off. Low-Power Wide-Area Networking (LPWAN) technologies need gateways or base stations for functioning. The gateway uploads data to a cloud server through traditional cellular networks like 4G. Symphony Link has an architecture very similar to LoRaWAN with higher degree of reliability appropriate for industrial applications. The power budget of LTE Cat-M1 9 (a network operator LPWAN) is 30% higher per bit than technologies like SigFox or LoRaWAN, which means more expensive batteries are required. Some IoT technologies like LoRa and SigFox only support uplink suited for monitoring while cellular IoT allows for both monitoring and control. LTE-M is a better option for agricultural weather and soil moisture sensor applications where more data usage is expected.
NB-IoT is more popular in EU and China and LTE Cat-M1 in the U.S. and Japan. T-Mobile is planning to deploy NB-IoT network in the U.S. by mid-2018 following a pilot project in Las Vegas. Verizon and AT&T launched LTE Cat-M1 networks last year and their IoT-specific data plans are available for purchase. Verizon and AT&T IoT networks cover a much greater area than LoRa or Sigfox. An IoT device can be connected to AT&T’s network for close to $1.00 per month, and to Verizon’s for as low as $2 per month for 1MB of data. A typical sensor message generally falls into 10-200 bytes range. With the overhead associated with protocols to send the data to the cloud, this may reach to 1KB. This can be used as a general guide to determine how much data to buy from a network operator.
Studies show there is a potential for over 50% water savings using sensor-based irrigation scheduling methods.
What the future holds
Many startup companies are currently focused on the software aspect of IoT, and their products lack sensor technology. The main problem they have is that developing good sensors is hard. Most of these companies will fail before the batteries of their sensors die. Few will survive or prevail in the very competitive IoT market. Larger companies that own sensor technologies are more concerned with the compatibility and interoperability of these IoT technologies and will be hesitant to adopt them until they have a clear picture. It is going to take time to see both IoT and accurate soil/plant sensors in one package in the market.
With the rapid growth of IoT in other areas, there will be an opportunity to evaluate different IoT technologies before adopting them in agriculture. As a company, you may be forced to choose specific IoT technology. Growers and consultants should not worry about what solution is employed to transfer data from their field to the cloud and to their computers or smartphones, as long as quality data is collected and costs and services are reasonable. Currently, some companies are using traditional cellular networks. It is highly likely that they will finally switch to cellular IoT like LTE Cat-M1. This, however, may potentially increase the costs in some designs due to the higher cost of cellular IoT data plans.
This week, guest author Dr. Michael Forster, of Edaphic Scientific Pty Ltd & The University of Queensland, writes about new research using irrigation curves as a novel technique for irrigation scheduling.
Growers do not have the time or resources to investigate optimal hydration for their crop. Thus, a new, rapid assessment is needed.
Measuring the hydration level of plants is a significant challenge for growers. Hydration is directly quantified via plant water potential or indirectly inferred via soil water potential. However, there is no universal point of dehydration with species and crop varieties showing varying tolerance to dryness. What is tolerable to one plant can be detrimental to another. Therefore, growers will benefit from any simple and rapid technique that can determine the dehydration point of their crop.
New research by scientists at Edaphic Scientific, an Australian-based scientific instrumentation company, and the University of Queensland, Australia, has found a technique that can simply and rapidly determine when a plant requires irrigation. The technique builds on the strong correlation between transpiration and plant water potential that is found across all plant species. However, new research applied this knowledge into a technique that is simple, rapid, and cost-effective, for growers to implement.
Current textbook knowledge of plant dehydration
The classic textbook values of plant hydration are field capacity and permanent wilting point, defined as -33 kPa (1/3 Bar) and -1500 kPa (15 Bar) respectively. It is widely recognized that there are considerable limitations with these general values. For example, the dehydration point for many crops is significantly less than 15 Bar.
Furthermore, values are only available for a limited number of widely planted crops. New crop varieties are constantly developed, and these may have varying dehydration points. There are also many crops that have no, or limited, research into their optimal hydration level. Lastly, textbook values are generated following years of intensive scientific research. Growers do not have the time, or resources, to completely investigate optimal hydration for their crop. Therefore, a new technique that provides a rapid assessment is required.
How stomatal conductance varies with water potential
There is a strong correlation between stomatal conductance and plant water potential: as plant water potential becomes more negative, stomatal conductance decreases. Some species are sensitive and show a rapid decrease in stomatal conductance; other species exhibit a slower decrease.
Plant physiologist refer to P50 as a value that clearly defines a species’ tolerance to dehydration. One definition of P50 is the plant water potential value at which stomatal conductance is 50% of its maximum rate. P50 is also defined as the point at which hydraulic conductance is 50% of its maximum rate. Klein (2014) summarized the relationship between stomatal conductance and plant water potential for 70 plant species (Figure 1). Klein’s research found that there is not a single P50 for all species, rather there is a broad spectrum of P50 values (Figure 1).
Figure 1. The relationship between stomatal conductance and leaf water potential for 70 plant species. The dashed red lines indicate the P80 and P50 values. The irrigation refill point can be determined where the dashed red lines intersect with the data on the graph. Image has been adapted from Klein (2014), Figure 1b.
Taking advantage of P50
The strong, and universal, relationship between stomatal conductance and water potential is vital information for growers. A stomatal conductance versus water potential relationship can be quickly, and easily, established by any grower for their specific crop. However, as growers need to maintain optimum plant hydration levels for growth and yield, the P50 value should not be used as this is too dry. Rather, research has shown a more appropriate value is possibly the P80 value. That is, the water potential value at the point that stomatal conductance is 80% of its maximum.
Irrigation Curves – a rapid assessment of plant hydration
Research by Edaphic Scientific and University of Queensland has established a technique that can rapidly determine the P80 value for plants. This is called an “Irrigation Curve” which is the relationship between stomatal conductance and hydration that indicates an optimal hydration point for a specific species or variety.
Once P80 is known, this becomes the set point at which plant hydration should not go beyond. For example, a P80 for leaf water potential may be -250 kPa. Therefore, when a plant approaches, or reaches, -250 kPa, then irrigation should commence.
P80 is also strongly correlated with soil water potential and, even, soil volumetric water content. Soil water potential and/or content sensors are affordable, easy to install and maintain, and can connect to automated irrigation systems. Therefore, establishing an Irrigation Curve with soil hydration levels, rather than plant water potential, may be more practical for growers.
Example irrigation curves
Irrigation curves were created for a citrus (Citrus sinensis) and macadamia (Macadamia integrifolia). Approximately 1.5m tall saplings were grown in pots with a potting mixture substrate. Stomatal conductance was measured daily, between 11am and 12pm, with an SC-1 Leaf Porometer. Soil water potential was measured by combining data from an MPS-6 (now called TEROS 21) Matric Potential Sensor and WP4 Dewpoint Potentiometer. Soil water content was measured with a GS3 Water Content, Temperature and EC Sensor. Data from the GS3 and MPS-6 sensors were recorded continuously at 15-minute intervals on an Em50 Data Logger. When stomatal conductance was measured, soil water content and potential were noted. At the start of the measurement period, plants were watered beyond field capacity. No further irrigation was applied, and the plants were left to reach wilting point over subsequent days.
Figure 2. Irrigation Curves for citrus and macadamia based on soil water potential measurements. The dashed red line indicates P80 value for citrus (-386 kPa) and macadamia (-58 kPa).
Figure 2 displays the soil water potential Irrigation Curves, with a fitted regression line, for citrus and macadamia. The P80 values are highlighted in Figure 2 by a dashed red line. P80 was -386 kPa and -58 kPa for citrus and macadamia, respectively. Figure 3 shows the results for the soil water content Irrigation Curves where P80 was 13.2 % and 21.7 % for citrus and macadamia, respectively.
Figure 3. Irrigation Curves for citrus and macadamia based on soil volumetric water content measurements. The dashed red line indicates P80 value for citrus (13.2 %) and macadamia (21.7 %).
From these results, a grower should consider maintaining soil moisture (i.e. hydration) above these values as they can be considered the refill points for irrigation scheduling.
Further research is required
Preliminary research has shown that an Irrigation Curve can be successfully established for any plant species with soil water content and water potential sensors. Ongoing research is currently determining the variability of generating an Irrigation Curve with soil water potential or content. Other ongoing research includes determining the effect of using a P80 value on growth and yield versus other methods of establishing a refill point. At this stage, it is unclear whether there is a single P80 value for the entire growing season, or whether P80 shifts depending on growth or fruiting stage. Further research is also required to determine how P80 affects plants during extreme weather events such as heatwaves. Other ideas are also being investigated.
For more information on Irrigation Curves, or to become involved, please contact Dr. Michael Forster: [email protected]
Reference
Klein, T. (2014). The variability of stomatal sensitivity to leaf water potential across tree species indicates a continuum between isohydric and anisohydric behaviours. Functional Ecology, 28, 1313-1320. doi: 10.1111/1365-2435.12289
Get better air temperature accuracy with this new method
Accurate air temperature is crucial for microclimate monitoring
The accuracy of air temperature measurement in microclimate monitoring is crucial because the quality of so many other measurements depend on it. But accurate air temperature is more complicated than it looks, and higher accuracy costs money. Most people know if you expose an air temperature sensor to the sun, the resulting radiative heating will introduce large errors. So how can the economical ATMOS 41’s new, non-radiation-shielded air temperature sensor technology be more accurate than typical radiation-shielded sensors?
We performed a series of tests to see how the ATMOS 41’s air temperature measurement compared to other sensors, and the results were surprising, even to us. Learn the results of our experiments and the new science behind the extraordinary accuracy of the ATMOS 41’s breakthrough air temperature sensor technology.
In this brief 30-minute webinar, find out:
Why you should care about air temperature accuracy
Where errors in air temperature measurement originate
The first principles energy balance equation and why it matters
Results of experiments comparing shielded sensor accuracy against the ATMOS 41 weather station
The science behind the ATMOS 41 and why its unshielded measurement actually works
The Global Learning and Observations to Benefit the Environment (GLOBE) Program is an international science and education program that provides students and the public worldwide with the opportunity to participate in data collection and the scientific process.
GLOBE has a huge impact in schools around the world.
Its mission is to promote the teaching and learning of science, enhance community environmental literacy and stewardship, and provide research quality environmental observations. The GLOBE program works closely with agencies such as NASA to do projects like validation of SMAP data and the Urban Heat Island/Surface Temperature Student Research Campaign. The figure below shows the impact GLOBE is having in schools worldwide.
Dixon Butler, former GLOBE Chief Scientist, is excited about the recent African project GLOBE is now participating in called the TAHMO project. He says, “Right now, in Kenya and Nigeria, GLOBE schools are putting in over 100 new mini-weather stations to collect weather data, and all that usable data will flow into the GLOBE database.”
Participating in real science at a young age gets youth more ready to be logical, reasoning adults.
Why Use Kids to Collect Data?
Dixon says kids do a pretty good job taking research quality environmental measurements. Working with agencies like NASA gets them excited about science, and participating in real science at a young age gets them more ready to be logical, reasoning adults. He explains, “The 21st century requires a scientifically literate citizenry equipped to make well-reasoned choices about the complex and rapidly changing world. The path to acquiring this type of literacy goes beyond memorizing scientific facts and conducting previously documented laboratory experiments to acquiring scientific habits of mind through doing hands-on, observational science.”
Dixon says when GLOBE started, the plan was to have the kids measure temperature. But one science teacher, Barry Rock, who had third-grade students using Landsat images to do ozone damage observations, called the White House and said, “Kids can do a lot more than measure temperature.” He gave a presentation at the White House where he showed a video of two third grade girls looking at Landsat imagery. They were discussing their tree data, and at one point, one said to the other, ‘That’s in the visible. Let’s look at it in the false color infrared.’ At that point, Barry became the first chief scientist of GLOBE, and he helped set up the science and the protocols that got the program started.
GLOBE uses online and in-person training and protocols to be sure the students’ data is research quality.
Can GLOBE Data be Used by Scientists?
GLOBE uses online and in-person training and protocols to be sure the students’ data is research quality. Dixon explains, “There was a concern that these data be credible, so the idea was to create an intellectual chain of custody where scientists would write the protocols in partnership with an educator so they would be written in an educationally appropriate way. Then the teachers would be trained on those protocols. The whole purpose is to be sure scientists have confidence that the data being collected by GLOBE is usable in research.”
Today GLOBE puts out a Teacher’s’ Guide and the protocols have increased from 17 to 56. The soil area went from just a temperature and moisture measurement to a full characterization. Dixon says, “We’ve been trying to improve it ever since, and I think we’re getting pretty good at it.”
GLOBE students were the only ones going around looking up at the sky doing visual categorization of clouds and counting contrails. It was just no longer being done, except by these students.
What About the Skeptics?
If you ask Dixon how he deals with skeptics of the data collected by the kids, he says, “I tell them to take a scientific approach. Check out the data, and see if they’re good. One year, a GLOBE investigator found a systematic error In U-tube maximum/minimum thermometers mounted vertically, which had been in use for over a century, that no one else found. The GLOBE data were good enough to look at and find the problem. There are things the data are good for and things they’re not good for. Initially, we wanted these data to be used by scientists in the literature, and there have been close to a dozen papers, but I would argue that GLOBE hasn’t yet gotten to the critical mass of data that would make that easier.”
GLOBE did have enough cloud data, however, to be used in an important analysis of geostationary cloud data where the scientist compared GLOBE student data with satellite data Dixon adds, “GLOBE students were the only ones going around looking up at the sky doing visual categorization of clouds and counting contrails. It was just no longer being done, except by GlOBE students. Now GLOBE has developed the GLOBE Observer app that lets everyone take and report cloud observations.”
Young minds need to experience the scientific approach of developing hypotheses, taking careful, reproducible measurements, and reasoning with data.
What’s the Future of GLOBE?
Dixon says GLOBE’s goal is to raise the next generation of intelligent constituents in the body politic. He says, “I thought about this a lot when I worked for the US Congress. In addition to working with GLOBE, I now have a non-profit grant-making organization called YLACES with the objective of helping kids to learn science by doing science. Young minds need to experience the scientific approach of developing hypotheses, taking careful, reproducible measurements, and reasoning with data. Inquiries should begin early and grow in quality and sophistication as learners progress in literacy, numeracy, and understanding scientific concepts. In addition to fostering critical thinking skills, active engagement in scientific research at an early age also builds skills in mathematics and communications. These kids will grow up knowing how to think scientifically. They’ll ask better questions, and they’ll be harder to fool. I think that’s what the world needs, and I see the environment and science as the easiest path to get there.”
Learn more about GLOBE and its database here and about YLACES at www.ylaces.org.