Figure 1
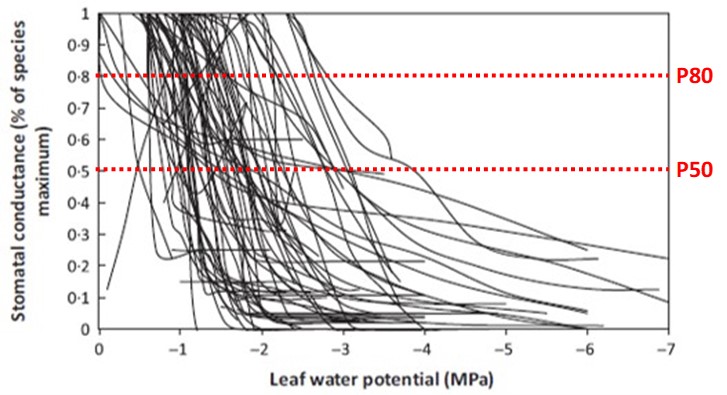
Figure 1. The relationship between transpiration (stomatal conductance) and leaf water potential for 70 plant species. The dashed red lines indicate the P80 and P50 values. The irrigation refill point can be determined where the dashed red lines intersect with the data on the graph. Image has been adapted from Klein (2014), Figure 1b.
No comments yet


