Heat wave
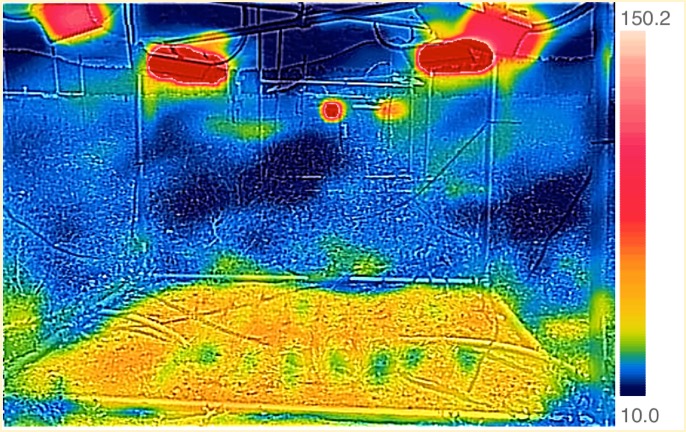
An infrared photo, which is how Rachel determined that the heating footprint was evenly distributed on all the plants. The scale bar on the right is in degrees C.
No comments yet
An infrared photo, which is how Rachel determined that the heating footprint was evenly distributed on all the plants. The scale bar on the right is in degrees C.


Copyright © 2024 Decagon Devices, Inc.. All rights reserved.