Skip to content

Posts tagged ‘micrometeorology’

Just released: ATMOS 41 comparison testing data

Climate parameters such as precipitation, air temperature, and wind speed can change considerably across short distances in the natural environment. However, most weather observations either sacrifice spatial resolution for scientific accuracy or research-grade accuracy for spatial resolution.

Researcher setting up an ATMOS 41 all-in-one weather station

ATMOS 41 all-in-one weather station

The ATMOS 41 represents an optimization of both. It was carefully engineered to maximize accuracy at a price point that allows for spatially distributed observations. Additionally, because many researchers need to avoid frequent maintenance and long setup times, the ATMOS 41 weather station was designed to reduce complexity and withstand long-term deployment in harsh environments. To eliminate breakage, it contains no moving parts, and it only requires recalibration every two years. Since all 14 measurements are combined in a single unit, it can be deployed quickly and with almost no effort. Its only requirement is to be mounted and leveled on top of a pole with an unobstructed view of the sky.

Comparison testing and sensor-to-sensor variability data

METER released the ATMOS 41 in January 2017 after extensive development and testing with partnerships across the world, in Africa, Europe, and the US. We performed comparison testing with high-quality, research-grade non-METER sensors and conducted time-series testing for sensor-to-sensor variability.

See weather sensor performance data for the ATMOS 41 weather station.

Explore which weather station is right for you.

Download the “Researcher’s complete guide to soil moisture”—>

Download the “Researcher’s complete guide to water potential”—>

Can a Leaf Wetness Sensor be a Rain Detector?

The PHYTOS 31 Leaf Wetness Sensor was designed to measure the presence and duration of water on leaf surfaces. However, Dr. Bruce Bugbee, professor of Crop Physiology at Utah State University, noticed that his leaf wetness sensor revealed interesting phenomena associated with some precipitation events. Here is what he observed on a recent day at the USU Environmental Observatory in Logan, Utah

Water droplets on a leaf

It is possible to have a day with numerous 0.1 mm increments of rain, followed by some evaporation, in which a rain gauge would not record any rain during the day.

“Recent data from our weather station provided two examples of the offset in measurement associated with tipping bucket rain gauges. It started raining on campus last night at exactly 20:00 hours, as indicated by the response of the leaf wetness sensor (Figure 1). The first 0.1 mm tip of the rain gauge occurred about 25 minutes later (Figure 2). The resolution for most high-quality tipping bucket rain gauges is listed as 0.1 mm, but this is not the resolution for the first 0.1 mm of rain.

Read more

Download the “Researcher’s complete guide to soil moisture”—>

Stop Hiding Behind a Shield

Get better air temperature accuracy with this new method

ATMOS 41 weather station standing in a field

Accurate air temperature is crucial for microclimate monitoring

The accuracy of air temperature measurement in microclimate monitoring is crucial because the quality of so many other measurements depend on it. But accurate air temperature is more complicated than it looks, and higher accuracy costs money. Most people know if you expose an air temperature sensor to the sun, the resulting radiative heating will introduce large errors. So how can the economical ATMOS 41’s new, non-radiation-shielded air temperature sensor technology be more accurate than typical radiation-shielded sensors?

We performed a series of tests to see how the ATMOS 41’s air temperature measurement compared to other sensors, and the results were surprising, even to us. Learn the results of our experiments and the new science behind the extraordinary accuracy of the ATMOS 41’s breakthrough air temperature sensor technology.

In this brief 30-minute webinar, find out:

  • Why you should care about air temperature accuracy
  • Where errors in air temperature measurement originate
  • The first principles energy balance equation and why it matters
  • Results of experiments comparing shielded sensor accuracy against the ATMOS 41 weather station
  • The science behind the ATMOS 41 and why its unshielded measurement actually works

Watch the webinar

See weather sensor performance data for the ATMOS 41 weather station.

Explore which weather station is right for you.

Download the “Researcher’s complete guide to soil moisture”—>

Where Will the Next Generation of Scientists Come From?

The Global Learning and Observations to Benefit the Environment (GLOBE) Program is an international science and education program that provides students and the public worldwide with the opportunity to participate in data collection and the scientific process.

Smiling students standing in a huge line

GLOBE has a huge impact in schools around the world.

Its mission is to promote the teaching and learning of science, enhance community environmental literacy and stewardship, and provide research quality environmental observations.  The GLOBE program works closely with agencies such as NASA to do projects like validation of SMAP data and the Urban Heat Island/Surface Temperature Student Research Campaign.  The figure below shows the impact GLOBE is having in schools worldwide.

Places, schools, teachers, pre-service, students, alumni, and GLOBE observations chart

Dixon Butler, former GLOBE Chief Scientist, is excited about the recent African project GLOBE is now participating in called the TAHMO project.  He says, “Right now, in Kenya and Nigeria, GLOBE schools are putting in over 100 new  mini-weather stations to collect weather data, and all that usable data will flow into the GLOBE database.”

Students standing together in front of their school

Participating in real science at a young age gets youth more ready to be logical, reasoning adults.

Why Use Kids to Collect Data?

Dixon says kids do a pretty good job taking research quality environmental measurements.  Working with agencies like NASA gets them excited about science, and participating in real science at a young age gets them more ready to be logical, reasoning adults.  He explains, “The 21st century requires a scientifically literate citizenry equipped to make well-reasoned choices about the complex and rapidly changing world. The path to acquiring this type of literacy goes beyond memorizing scientific facts and conducting previously documented laboratory experiments to acquiring scientific habits of mind through doing hands-on, observational science.”

Dixon says when GLOBE started, the plan was to have the kids measure temperature.  But one science teacher, Barry Rock, who had third-grade students using Landsat images to do ozone damage observations, called the White House and said, “Kids can do a lot more than measure temperature.” He gave a presentation at the White House where he showed a video of two third grade girls looking at Landsat imagery. They were discussing their tree data, and at one point, one said to the other, ‘That’s in the visible. Let’s look at it in the false color infrared.’  At that point, Barry became the first chief scientist of GLOBE, and he helped set up the science and the protocols that got the program started.

Students standing around and talking before class

GLOBE uses online and in-person training and protocols to be sure the students’ data is research quality.

Can GLOBE Data be Used by Scientists?

GLOBE uses online and in-person training and protocols to be sure the students’ data is research quality.  Dixon explains, “There was a concern that these data be credible, so the idea was to create an intellectual chain of custody where scientists would write the protocols in partnership with an educator so they would be written in an educationally appropriate way.  Then the teachers would be trained on those protocols. The whole purpose is to be sure scientists have confidence that the data being collected by GLOBE is usable in research.”

Today GLOBE puts out a Teacher’s’ Guide and the protocols have increased from 17 to 56.  The soil area went from just a temperature and moisture measurement to a full characterization.  Dixon says, “We’ve been trying to improve it ever since, and I think we’re getting pretty good at it.”  

Smiling student looking at the camera

GLOBE students were the only ones going around looking up at the sky doing visual categorization of clouds and counting contrails. It was just no longer being done, except by these students.

What About the Skeptics?

If you ask Dixon how he deals with skeptics of the data collected by the kids, he says, “I tell them to take a scientific approach.  Check out the data, and see if they’re good.  One year, a GLOBE investigator found a systematic error In U-tube maximum/minimum thermometers mounted vertically, which had been in use for over a century, that no one else found. The GLOBE data were good enough to look at and find the problem.  There are things the data are good for and things they’re not good for. Initially, we wanted these data to be used by scientists in the literature, and there have been close to a dozen papers, but I would argue that GLOBE hasn’t yet gotten to the critical mass of data that would make that easier.”

GLOBE did have enough cloud data, however, to be used in an important analysis of geostationary cloud data where the scientist compared GLOBE student data with satellite data Dixon adds, “GLOBE students were the only ones going around looking up at the sky doing visual categorization of clouds and counting contrails. It was just no longer being done, except by GlOBE students. Now GLOBE has developed the GLOBE Observer app that lets everyone take and report cloud observations.”

Young boys smiling at the camera together

Young minds need to experience the scientific approach of developing hypotheses, taking careful, reproducible measurements, and reasoning with data.

What’s the Future of GLOBE?

Dixon says GLOBE’s goal is to raise the next generation of intelligent constituents in the body politic. He says, “I thought about this a lot when I worked for the US Congress.  In addition to working with GLOBE, I now have a non-profit grant-making organization called YLACES with the objective of helping kids to learn science by doing science.  Young minds need to experience the scientific approach of developing hypotheses, taking careful, reproducible measurements, and reasoning with data. Inquiries should begin early and grow in quality and sophistication as learners progress in literacy, numeracy, and understanding scientific concepts. In addition to fostering critical thinking skills, active engagement in scientific research at an early age also builds skills in mathematics and communications. These kids will grow up knowing how to think scientifically. They’ll ask better questions, and they’ll be harder to fool.   I think that’s what the world needs, and I see the environment and science as the easiest path to get there.”

Learn more about GLOBE and its database here and about YLACES at www.ylaces.org.

Download the “Researcher’s complete guide to soil moisture”—>

Get more information on applied environmental research in our

New Weather Station Technology in Africa-3

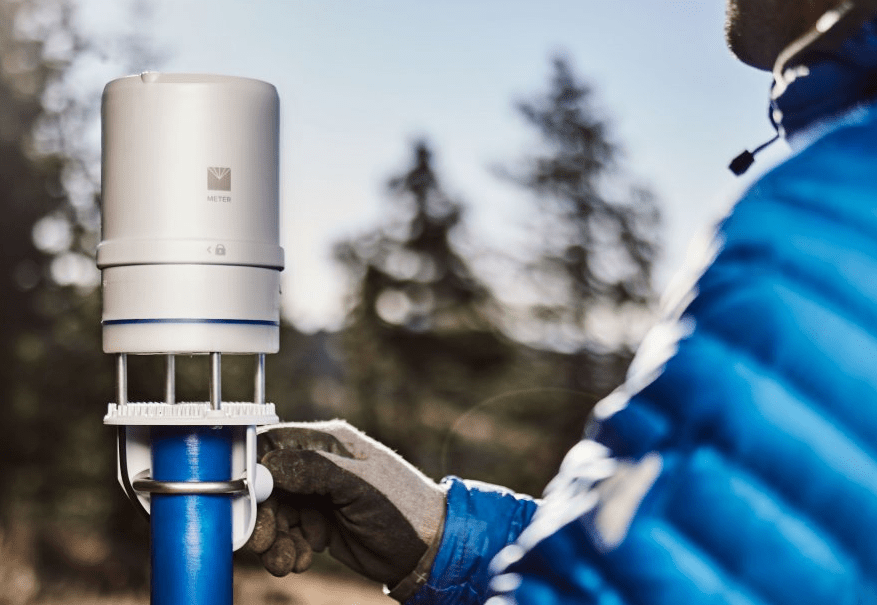
The Trans African Hydro and Meteorological Observatory (TAHMO) project expects to put 20,000 ATMOS 41 weather stations over Africa in order to understand the weather patterns which affect that continent, its water, and its agriculture. In the conclusion of our 3-part series, we interview Dr. John Selker about his thoughts on the project.

Image of the earth from far away

The economics of weather data value may be going up because we’re reaching a cusp in terms of humanity’s consumption of food.

In your TEDx talk you estimate that US weather stations directly bring U.S. consumers  31 billion dollars in value per year. Can Africa see that same kind of return?

Even more.  The economics of weather data value may be going up because we’re reaching a cusp in terms of humanity’s consumption of food.  Africa, one could argue, is the breadbasket for this coming century.  Thus, the value of information about where we could grow what food could be astronomical.  It’s very difficult to estimate.  One application of weather data is crop insurance.  Right now, crop insurance is taking off across Africa. The company we’re working with has 180,000 clients just in Kenya.  When we talked about 31 billion dollars in the U.S., that is the value citizens report, but you need to add to that protection against floods, increased food production, water supply management, crop insurance and a myriad of other basic uses for weather data.  In Africa, the value of this type of protection alone pays for over 1,000 times the cost of the weather stations.

Another application for weather data is that in Africa, the valuation of land itself is uncertain. So if, because of weather station data, we find that a particular microclimate is highly valuable, suddenly land goes from having essentially no value to becoming worth thousands of dollars per acre.  It’s really difficult to estimate the impact the data will have, but it could very well end up being worth trillions of dollars.  We have seen this pattern take place in central Chile, where land went from about $200/hectare in 1998 to over $3,000/ha now due to the understanding that it was exceptionally suited to growing pine trees, which represented a change in land value exceeding $3 billion.

Does the effect of these weather stations go beyond Africa?

There’s limited water falling on the earth, and if you can’t use weather data to invest in the right seeds, the right fertilizer, and plant at the right time in the right place, you’re not getting the benefit you should from having tilled the soil.  So for Africa the opportunity to improve yields with these new data is phenomenal.  

In terms of the world, the global market for calories is now here, so if we can generate more food production in Africa, that’s going to affect the price and availability of food around the world.  The world is one food community at this point, so an entire continent having inefficient production and ineffective structures costs us all.

Students stand in front of an installation site in Africa

If we can generate more food production in Africa, that’s going to affect the price and availability of food around the world.

You’re collecting data from Africa. Is it time to celebrate yet?

I think this is going to be one of those projects where we are always chilling the champagne and never quite drinking it.  It is such a huge scope trying to work across a continent.  So I would say we’ve got some stations all over Africa, we’re learning a lot, and we’ve got collaborators who are excited.  We have reason to feel optimistic.  It will be another five years before I’ll believe that we have a datastream that is monumental.  Right now we’re still getting the groundwork taken care of.  By September of this year we expect to have five hundred of stations in place, and then two years from now, over two thousand. This will be a level of observation that will transform the understanding of African weather and climate.

Two workers working hard in a field

This is a project of hundreds of people across the world putting their hands and hearts in to make this possible.

How do you deal with the long wait for results?  

In science, there is that sense you get when you want to know something, and you can see how to get there.  You have a theory, and you want to prove it.  It kind of captures your imagination.  It’s a combination of curiosity and the potential to actually see something happen in the world: to go from a place where you didn’t know what was going on to a place where you do know what’s going on.  I think about Linus Pauling, who made the early discoveries about the double helix.  He had in his pocket the X-ray crystallography data to show that the protein of life was in helical form, and he said, “In my pocket, I have what’s going to change the world.”  When we realized the feasibility of TAHMO, we felt much the same way.”  

Sometimes in your mind, you can see that path: how you might change the world.  It may never be as dramatic as what Pauling did, but even a small contribution has that same excitement of wanting to be someone who added to the conversation, who added to our ability to live more gracefully in the world.  It’s that feeling that carries you along, because in most of these projects you have an idea, and then ten years later you say, “why was it that hard?”  

Things are usually much harder than your original conception, and that energy and curiosity really helps you through some of the low points in your projects.  So, curiosity has a huge influence on scientific progress.  Changing the world is always difficult, but the excitement, curiosity, and working with people, it all fits together to help us draw through the tough slogs.  In TAHMO, I cannot count the number of people who have urged us to keep the effort moving forward and given a lift just when we needed it most.  This is a project of hundreds of people across the world putting their hands and hearts in to make this possible.  Having these TAHMO supporters is an awesome responsibility and concrete proof of the generosity and optimism of the human spirit.

Learn how you can help TAHMO.

See weather sensor performance data for the ATMOS 41 weather station. 

Explore which weather station is right for you.

Download the “Researcher’s complete guide to soil moisture”—>

New Weather Station Technology in Africa (Part 2)

Weather data improve the lives of many people. But, there are still parts of the globe, such as Africa, where weather monitoring doesn’t exist (see part 1). John Selker and his partners intend to remedy the problem through the Trans African Hydro Meteorological Observatory (TAHMO).  Below are some challenges they face.

Researcher holding an ATMOS 41 weather station in Africa

TAHMO aims to deploy 20,000 weather stations across the continent of Africa in order to fill a hole that exists in global climate data.

Big Data, Big Governments, and Big Unknowns

Going from an absence of data to the goal of 20,000 all-in-one weather stations offers hope for positive changes. However, Selker is still cautious. “Unintended consequences are richly expressed in the history of Africa, and we worry about that a lot. It’s an interesting socio-technical problem.”  This is why Selker and others at TAHMO are asking how they can bring this technology to Africa in a way that fits with their cultures, independence, and the autonomy they want to maintain. 

TAHMO works with the government in each country stations are deployed in; negotiating agreements and making sure the desires of each recipient country are met. Even with agreements in place, the officials in each country will do what is in the best interest of the people: a gamble in countries where corruption is a factor which must be addressed. Selker illustrates this point by recalling an instance in 1985 when he witnessed a corrupt government official take an African farmer’s land because the value had increased due to a farm-scale water development project.

Most TAHMO weather stations are hosted and maintained by a local school, making it available as an education tool for teachers to use to teach about climate and weather. Data from TAHMO are freely available to the government in the country where the weather station is hosted, researchers who directly request data, and to the school hosting and maintaining the weather station. Commercial organizations will be able to purchase the data, and the profits will be used to maintain and expand the infrastructure of TAHMO.

Researchers standing in front of a sign

Selker says it’s all about collaboration.

Terrorism, Data, and Open Doors

“When I wanted to go out and put in weather stations, my wife said, ‘No, you will not go to Chad.’ … because it is Boko Haram central,” Selker says.

The Boko Haram— a terrorist organization that has pledged allegiance to ISIS— creates an uncommon hurdle. Currently, the Boko Haram is most active in Nigeria, but has made attacks in Chad, Cameroon, and Niger.

Selker also mentioned similar issues with ISIS, “When ISIS came through Mali, the first thing they did is destroy all the weather stations. So they have no weather data right now in Mali.” Acknowledging the need for security, he adds, “we’re  completing the installation of  eight stations [in Mali] in April.”

“We have good contacts [in Nigeria] and they’re working hard to get permission to put up stations right now in that area. We’ve shipped 15 stations which are ready to install. With these areas we can’t go visit, it’s all about collaboration. It’s about partners and people you know. We have a partnership with a tremendous group of Africans who are really the leading edge of this whole thing.”

Excited students running towards the camera

Most TAHMO weather stations are hosted and maintained by a local school.

A Hopeful Future

Despite the challenges of getting this large-scale research network off the ground, Selker and his group remain hopeful.  About his weather data he says, “It’s not glamorous stuff, you won’t see it on the cover of magazines, but these are the underpinnings of a successful society.”

Selker optimistically adds, “We are in a time of incredible opportunity.”

Learn more about TAHMO

Next Week:  Read an interview with Dr. John Selker on his thoughts about TAHMO.

See weather station performance data for the ATMOS 41.

Explore which weather monitoring system is right for you.

Download the “Researcher’s complete guide to soil moisture”—>

New Weather Station Technology in Africa

Weather data, used for flight safety, disaster relief, crop and property insurance, and emergency services, contributes over $30 billion in direct value to U.S. consumers annually. Since the 1990’s in Africa, however, there’s been a consistent decline in the availability of weather observations. Most weather stations are costly and require highly trained individuals to maintain. As a result, weather stations in African countries have steadily declined over the last seventy years. Oregon State University’s, Dr. John Selker and his partners intend to remedy the problem through his latest endeavor— the Trans African Hydro Meteorological Observatory (TAHMO).

Image of the earth and a huge storm on the surface

Weather data improve the lives of many people. But, there are still parts of the globe where weather monitoring doesn’t exist.

Origins of TAHMO

TAHMO is a research-based organization that aims to deploy 20,000 all-in-one weather stations across the continent of Africa in order to fill a hole that exists in global climate data. TAHMO originated from a conversation between Selker and Dr. Nick van de Giesen from Delft University of Technology while doing research in Ghana. Having completed an elaborate study on canopy interception at a cocoa plantation in 2006, they hit a “data wall.” There was virtually no weather data available in Ghana, a problem shared by most African countries. This opened the door to what would later become TAHMO.

Students standing around an installation site

The majority of weather stations are being installed at local schools where teachers are using the data in their classroom lessons.

Logistics and Equipment

Originally Selker and van de Geisen set out to make a $100 weather station, which Selker admitted, “turned out to be harder than we thought.” Not only was making a widely-deployable, affordable, research-grade, no-moving-parts weather station difficult, but additional challenges presented themselves.

“The model of how we might measure the weather in Africa, the whole business model, the production model, infrastructure support, the database and delivery system, the agreements with the countries, agreements with potential data-buyers, that all took us a long time to sort out.” Despite these challenges, in 2010 it started to look feasible. “That’s when we really started to figure out what the technology we were going to use was going to look like.”

After giving a lecture at Washington State University, Selker spoke with Dr. Gaylon Campbell about the project, which led to a long development-deployment-development cycle. Eventually, the final product emerged as a low-maintenance, no-moving-parts, cellular-enabled, solar-powered weather station.

Young boy carrying a bag on his head and walking down the road

An estimated 60 percent of the African population earn their income by farming.

Agricultural Benefits of Weather Stations

Crop insurance, a service that is widely used in developed countries, relies on weather data. Once historical data exists, insurance rates can be set, and farmers can purchase crop insurance to replace a crop that is lost to drought, weather, wildfire, etc. On a continent with the largest percentage of the total population subsistence farming, this empowers farmers to take larger risks. Without insurance, farmers need to conserve seed, saving enough to eat and plant again if a crop fails. With crop insurance, crop loss is not as devastating, and farmers can produce larger yields without worrying about losing everything. Hypothetically, this would lead to more food available to the global market, stabilizing food prices year over year.

Crop insurance aside, weather data provide growers with information like when to plant, when not to plant, what crops to plant, and when and if to treat for disease. For rainfed crops, this can mean the difference between a successful yield and a failure.

“Currently in most African countries, the production per acre is about one-sixth of that in the United States. That is the biggest opportunity, in my opinion, for sustainable growth without having to open up new tracts of land. The land is already under cultivation, but we can up productivity, probably by a factor of four, by giving information about when to plant,” Selker comments.  

Despite the social benefits, Selker makes it clear that the TAHMO effort is based on mutual benefit: “We are here for a reason, we want these data to advance our research on global climate processes.  This is a global win-win partnership.”

Learn how you can help TAHMO by getting active.

Next week:  Read about some of the challenges facing TAHMO

See performance data for the ATMOS 41 scientific weather station.

Explore which weather monitoring system is right for you.

Download the “Researcher’s complete guide to soil moisture”—>

Can Canopy Measurements Determine Soil Moisture?

As a young university student, Dr. Y. Osroosh, now a researcher at Washington State University, wanted to design the most accurate soil moisture sensor.  Over the years, however, he began to realize the complexity and difficulty of the task.  Inspired by the work of Jackson et al. (1981) and researchers in Bushland, TX, he now believes that plants are the best soil moisture sensors.  He and his team developed a new model for interpreting plant canopy signals to indirectly determine soil moisture.

Apples on an open air tree

The team measured microclimatic data in an apple orchard.

How Can Plants Indicate Water in Soil?

Osroosh and his team wanted to use plant stress instead of soil sensors to make irrigation decisions in a drip-irrigated Fuji apple tree orchard. But, the current practice of using the crop water stress index (CWSI) for detecting water stress presented some problems, Osroosh comments, “Currently, scientists use either an empirical CWSI or a theoretical one developed using equations from FAO-56, but the basis for FAO-56 equations is alfalfa or grass, which isn’t similar to apple trees.”  One of the main differences between grass and apple trees is that apple tree leaves are highly linked to atmospheric conditions. They control their stomata to avoid water loss.  

Apple tree canopy in an open air field

There is high degree of coupling between apple leaves and the humidity of the surrounding air.

So Osroosh borrowed a leaf porometer to measure the stomatal conductance of apple trees, and he developed his own crop water stress index, based on what he found.  He explains,We developed a new theoretical crop water stress index specifically for apple trees. It accounts for stomatal regulations in apple trees using a canopy conductance sub-model. It also estimates average actual and potential transpiration rates for the canopy area which is viewed by a thermal infrared sensor (IRT).”

Fuji open air apple orchard (Roza Farm, Prosser, WA).

Fuji apple orchard (Roza Farm, Prosser, WA) where Osroosh performed his research.

What Data Was Used?

Osroosh says they established their new “Apple Tree” CWSI based on the energy budget of a single apple leaf, so “soil heat flux” was not a component in their modeling. He and his team measured soil water deficit using a neutron probe in the top 60 cm of the profile, and they collected canopy surface temperature data using thermal infrared sensors. The team also measured microclimatic data in the orchard.  

Close up of an apple on a tree

Neutron probes were problematic, as they did not allow collection of data in real time.

Osroosh comments, “The accuracy of this approach greatly depends on the accuracy of reference soil moisture measurement methods.  To establish a relationship between CWSI and soil water, we needed to measure soil water content in the root zone precisely. We used a neutron probe, which provides enough precision and volume of influence to meet our requirements.  However, it was a labor and time intensive method which did not allow for real-time measurements, posing a serious limitation.”

Next week: Learn the results of Dr. Osroosh’s experiments, the future of this research, and about other researchers who are trying to achieve similar goals.

Download the “Researcher’s complete guide to soil moisture”—>

Download the “Researcher’s complete guide to water potential”—>

Download the “Researcher’s complete guide to leaf area index (LAI)”—>

Get more information on applied environmental research in our