How to calculate growing degree days (or thermal time)
If you’re not using an accurate weather station at your field site to gather data for growing degree day (GDD) or thermal time calculations, you should start now.

GDD predictions save you hours of scouting time and can increase yield because they’re a scientific way to know the best time for insect/disease control measures. In this chalk talk, Dr. Colin Campbell explains the concept of thermal time (or growing degree days) and shows two different ways to calculate it.
Video transcript
Hello, my name is Dr. Colin Campbell. I’m a senior research scientist here at METER Group. Today, we’re going to give a brief primer on thermal time. When I talked to some of my colleagues about that, they mentioned that thermal time (or growing degree days) is really just a way to match a plant’s clock with our clock. It helps us understand what’s happening with the plant, and we can predict things like emergence, maturity, etc. And the way we do this is through this equation that is pretty simple (Equation 1).

We can sum thermal time (Tn) by taking the summation of day one to day n of the average temperature (meaning T max plus T min divided by two), minus a base temperature (Tbase), and then multiply by time step (delta t). And in this case, our time step is just one day.
So the whole analysis is simply the average temperature minus a base temperature. We get that value each day. And then we keep summing until it reaches a value that tells us that we’ve progressed from one stage to another stage.
A good example of this is wheat. When I was young, I did an experiment on this in biology. The idea was that for emergence, the wheat plant needs 78 day degrees from planting to emergence. So I used Equation 1, and when I had summed enough day degrees, I knew the wheat was moving from the planting stage to a post emergent stage. I went out and measured the wheat and it actually matched up well. Not every wheat plant emerged at that point, but the average was quite close.
So what does that mean in terms of graphical data? I wanted to show you what this equation actually looked like and then plant a seed in your mind for our next discussion, which will be, how good is this analysis? If you think about modern technology, like the ATMOS 41 weather station, you can get temperature measurements that are every five minutes or even every one minute. So wouldn’t it be better if we collected our thermal time information with this equation (Equation 2)?
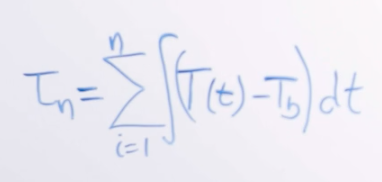
We can take the sum over each day, like we did in Equation 1, but instead we take the integral of temperature at a small time step T(t) (like five minutes) minus the base temperature (Tb) and then just integrate this across the day. We’re going to learn about that in my next chalk talk. But for now, let’s go to this graph (Figure 1).
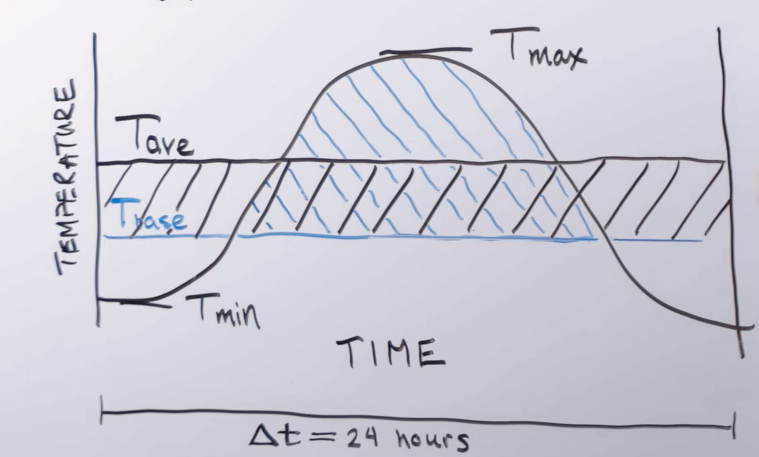
In Figure 1, we have temperature on the y axis and time on the x axis. The total time is 24 hours. This is our daily step, where we’re collecting this information about thermal time. And here are all the parameters from the equation: the maximum temperature (Tmax), the minimum temperature (Tmin), and the average temperature (Tave). And then this is a base temperature (Tbase). And to familiarize you with what we’re talking about, Tbase is the temperature below which progress is not made in the development of this plant. The progress is not reversed, meaning if it’s below the base temperature, the plant is not reversing its development, but it just doesn’t progress.
The black line is what I’ve drawn as a typical diurnal temperature swing. So it’s going from a minimum in the early morning up to a maximum sometime in the afternoon. And I’ve tried to compare these two approaches. One one side, we have the average temperature and the base temperature. This rectangle is our thermal time for that day. But the question is, with all our temperature data (like from the ATMOS 41) where we have pretty small time increments, could we instead just integrate over the day and then collect all the information on thermal time that is below this black line (the actual temperature, and of course, we subtract out the base temperature). How much difference does that make compared to this here? And what are the implications of not being able to measure our temperature terribly accurately? We’re going to talk about that in our next discussion, and I look forward to seeing you then.
Take our Soil Moisture Master Class
Six short videos teach you everything you need to know about soil water content and soil water potential—and why you should measure them together. Plus, master the basics of soil hydraulic conductivity.
Learn more
Automate your growing degree day (GDD) models using the ATMOS 41 weather station and ZENTRA Cloud software.
See ATMOS 41 weather station performance data.


